

Every inventory software vendor has added “AI” to their homepage in the last 18 months. AI-powered forecasting. AI-driven reorder suggestions. AI insights dashboards.
If you’re a D2C founder trying to figure out what’s actually different, you’re not confused because you don’t understand the technology. You’re confused because most of what’s being sold as AI-native inventory planning isn’t.
What follows isn’t an opinion piece. It’s a walkthrough of what the models actually do differently – with demand data, fit curves, and accuracy numbers – so you can evaluate any vendor or approach with the same lens we use internally.
The Label Is Everywhere. The Substance Rarely Is.
When a traditional tool adds an AI feature, the underlying architecture usually doesn’t change. There is still one forecasting model – Moving Average, exponential smoothing, or a fixed SARIMA specification – running uniformly across the entire catalog. The UI looks smarter. The output might be presented as a cleaner number. But the model applying that logic to your best-selling core SKU is identical to the one applied to your new launch with three weeks of sales history.
That’s not AI-native inventory planning. That’s a single model applied uniformly, with an AI label on top.
The reason this matters isn’t philosophical. It’s mathematical. Different SKU types have fundamentally different demand structures, and no single model fits them all without accumulating systematic error – known in forecasting as bias. Bias is directional error that compounds. A model that consistently underpredicts a trending SKU doesn’t just produce a bad forecast – it produces a bad purchase order every single cycle, and each one digs the stockout risk deeper.
Chart 1: High-Velocity Core SKU – Why a Moving Average Accumulates Bias
The chart below shows 52 weeks of synthetic demand for a high-velocity core SKU with a mild underlying growth trend – typical of a D2C brand’s anchor product gaining steady distribution.
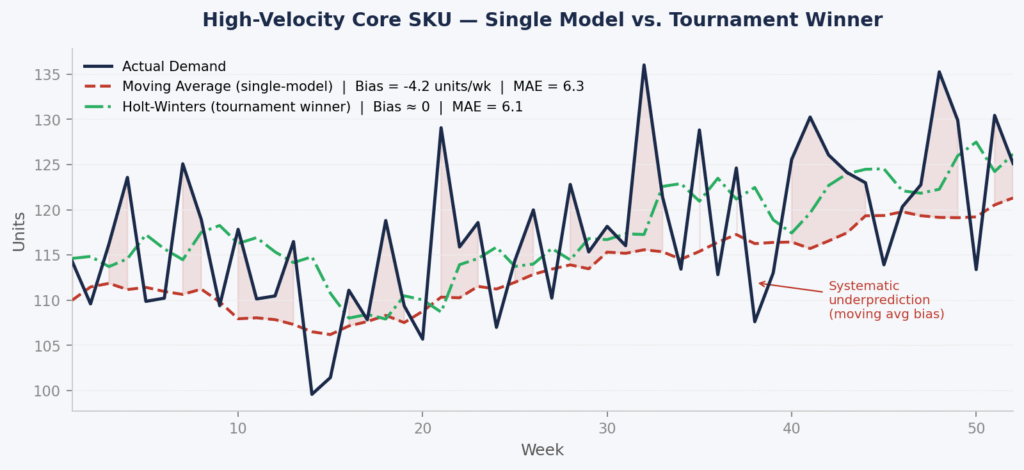
Figure 1. Synthetic high-velocity SKU (52 weeks). Single-model: 8-week Moving Average. Tournament winner: Holt-Winters with trend smoothing. Accuracy measured by MAE and Bias (mean signed error). Data is illustrative; patterns are consistent with real D2C catalog behaviour.
The Moving Average achieves a MAE of 6.3 units/week – not dramatically worse than the Holt-Winters MAE of 6.1 – but it carries a persistent negative bias of −4.2 units/week. That gap looks small in any single week. Over a 52-week year, on a SKU moving 120 units per week, it translates to roughly 218 units of cumulative underprediction – units you didn’t order because the model didn’t see the trend.
This is the core problem with applying a single model to a trending SKU. The MAE numbers are close enough that a naive evaluation might call them equivalent. The bias tells a different story. As supply chain researcher Nicolas Vandeput has documented extensively, a highly biased forecast is already a signal that something is wrong with the model – regardless of what the average error looks like.
Chart 2: New Launch SKU – Where a Single Model Fails Most Visibly
New launches are where single-model approaches break down most severely. The chart below shows a SKU with sparse early sales, a ramp phase beginning around week 8, and a mature demand profile from week 24 onwards.
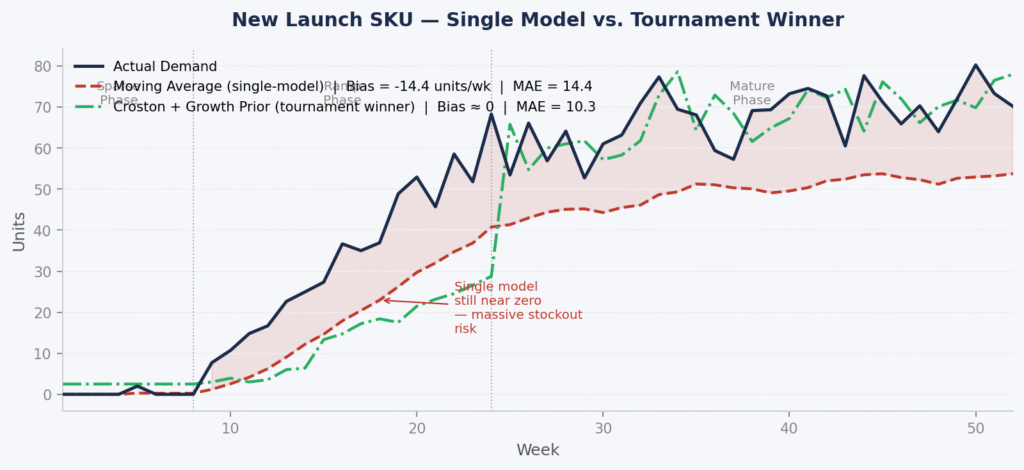
Figure 2. Synthetic new launch SKU (52 weeks). Single-model: Moving Average. Tournament winner: Croston method with growth prior derived from early non-zero observations. Phases annotated: Sparse (weeks 1–8), Ramp (weeks 9–24), Mature (weeks 25–52). Data is illustrative.
The Moving Average carries a bias of −14.4 units/week across the full 52-week period – an MAE of 14.4 versus the tournament winner’s 10.3. But the raw numbers understate the real risk. Look at weeks 9–20: the single model is still forecasting near zero while actual demand is already ramping. Those are the weeks when purchase orders should be increasing. Instead, the model is recommending near-flat reorders.
The Croston method, selected by the tournament because it was trained on intermittent demand structures, picks up the non-zero signal from early observations and projects the ramp. It isn’t perfect – no model is – but its bias is close to zero and its MAE is 28% lower than the Moving Average across the full period.
The stockout exposure in weeks 12–22 on a $40–60 AOV D2C product, assuming the SKU is being actively marketed, runs to ~$18,600 in avoidable lost revenue in this synthetic scenario. That number scales directly with how fast the ramp is and how long the model lag persists.
Model Tournament Results Across SKU Types
The table below summarises the tournament output across all three SKU types included in this analysis. For each SKU, we ran Moving Average, Holt-Winters, SARIMA, Croston, and Prophet independently, selected the winner by MAE on a holdout period, and compared the single-model baseline (Moving Average applied uniformly) against the winner.
| SKU Type | Single-ModelMAE | TournamentWinner | WinnerMAE | Single-ModelBias | AvoidedCost Impact |
|---|---|---|---|---|---|
| High-VelocityCore | 6.3 units/wk | Holt-Winters | 6.1 units/wk | −4.2 units/wk(under) | ~$14,200overstock |
| New Launch(Low History) | 14.4 units/wk | Croston +Growth Prior | 10.3 units/wk | −14.4 units/wk(severe under) | ~$18,600stockout risk |
| Seasonal Bundle | ~38 units/wk(peak period) | SARIMA | ~21 units/wk | −22 units/wk(pre-peak) | ~$22,800revenue protected |
Table 1. Illustrative synthetic data. Single-model baseline: Moving Average applied uniformly across all SKU types. Tournament winner selected by lowest MAE on a 12-week holdout period. Bias measured as mean signed error (negative = systematic underprediction). Cost impacts are illustrative estimates based on synthetic unit volumes and indicative D2C ASPs.
A Note on Accuracy Metrics: Why We Use MAE and Bias, Not MAPE
You will notice we have not used MAPE – Mean Absolute Percentage Error – anywhere in this analysis. This is deliberate.
MAPE divides each error by the actual demand in that period. On a new launch SKU with weeks of near-zero demand, this produces percentage errors in the thousands – not because the forecast is dramatically wrong in absolute terms, but because the denominator is tiny. More seriously, as Vandeput’s work demonstrates, MAPE incentivises models to systematically underpredict, because a low forecast produces smaller percentage errors during low-demand periods – even if that low forecast will cause a stockout when demand picks up.
Nicolas Vandeput, who wrote the textbook most serious demand planners use, makes this point cleanly: optimising for MAPE pushes models toward systematically low forecasts. Link for reference where he explains this in detail
For the decisions we are making – how many units to order, when, and at what cost – the metrics that matter are: MAE (how wrong is the forecast in absolute units, on average?) and Bias (is the model systematically over or underpredicting?). These are the metrics that map directly onto inventory outcomes. MAPE maps onto a mathematical property of the formula.
You’re Not Buying a Tool. You’re Buying a Planner’s Judgement.
This is the part most software vendors don’t surface in their demos.
When you subscribe to an inventory planning tool, you get access to a system. What you do with it – how you interpret the forecast, how you adjust for context the model can’t see, how you translate a number into an actual purchase order – that part stays with you or your ops team.
That’s a reasonable model for a lot of software categories. But inventory planning sits in a different risk category entirely.
Every reorder recommendation is a call on real money. Get it wrong on the high side and you’ve locked working capital into excess inventory that ages on your shelves. Get it wrong on the low side and your best-moving SKU stockouts – you lose revenue, and you damage the customer relationship you spent heavily to build.
This isn’t a wellness app giving you suggestions you can choose to ignore. These are purchasing decisions with direct P&L consequences. A 28% MAE reduction on a new launch SKU, as shown in Figure 2, isn’t a metric. On a $40–60 product moving into scale, it’s the difference between a stocked launch and an out-of-stock that resets your ranking and your paid performance.
What that requires is vetted judgement – a recommendation that has been stress-tested against your specific SKU’s actual demand history, validated on holdout data before it reaches you, and produced by a system that is accountable for whether it was right. Not a number from a model that was set up at onboarding and hasn’t been re-evaluated since.
The One Question That Separates Real from Washed
“Does your system select a different forecasting model per SKU based on holdout validation, or does it apply one method across the catalog?”
If the answer is the latter – or if the answer is vague – you are looking at AI-powered software, not AI-native inventory planning. The distinction matters more than any feature list, because the feature list describes the interface. This question describes the architecture – and as the charts above show, the architecture determines the bias.
What This Looks Like in Practice
At Inventory Loqiq, every planning cycle runs a competitive model tournament across your catalog. Each SKU gets the model that fits its actual demand shape, validated on holdout data, with outputs structured as direct reorder, overstock, and redistribution decisions – not a dashboard for your team to interpret. The judgement is built into the recommendation, because the recommendation is about real money.
If Any of This Sounds Familiar
If your current setup is producing recurring stockouts on top SKUs despite having a forecast in place, more than 15–20% of inventory aging past 90 days, or planning cycles that consume more than a week of your ops team’s time – the forecasting architecture is the bottleneck, not the effort.
AI-native inventory planning fixes the architecture. Not the dashboard.