

Why Your Inventory Forecasting Is Failing — And It's Not Your Team's Fault | Inventory LoqiqMost D2C brands running inventory forecasting across more than 20 SKUs hit the same wall eventually.You have a spreadsheet. Maybe a dedicated tool. Maybe a BI dashboard that someone on your team spent three months building. Your ops people are doing the work, running numbers every cycle, adjusting reorder points, trying to read the signals.
And you’re still stocking out on your best movers. Still sitting on slow inventory that’s eating working capital. Still making gut calls when the model doesn’t feel right.
Here’s the thing: the problem is rarely effort. The problem is that most forecasting approaches are built on a flawed assumption that nobody questions, because it’s baked into the tool itself.
One Model for Every SKU. That’s the Problem.
Pick any mainstream inventory tool or forecasting spreadsheet and look at what’s actually happening under the hood. There’s a method being applied: moving average, exponential smoothing, SARIMA, something. The parameters might be tunable. The UI might be sophisticated. But there’s one model, applied uniformly across your catalog.
The assumption is that demand behaves roughly the same across SKUs, and that the same mathematical approach can describe all of it. It’s a reasonable assumption for a business with ten products and stable sales. It falls apart fast once you have any real complexity.
Think about what’s actually in your catalog. Your best-selling core SKU has consistent weekly demand with minor noise. Your winter bundle has demand that’s almost zero for eight months and then spikes hard. A niche variant might sell two units one week and nothing for the next three. A new launch has almost no history at all, so any model is essentially guessing.
These are not variations of the same demand shape. They’re fundamentally different patterns that require different mathematics. The model that works well for your core SKU will systematically over-forecast your intermittent tail and completely misread a new launch. When you apply one method to all of them, you’re not forecasting. You’re averaging.
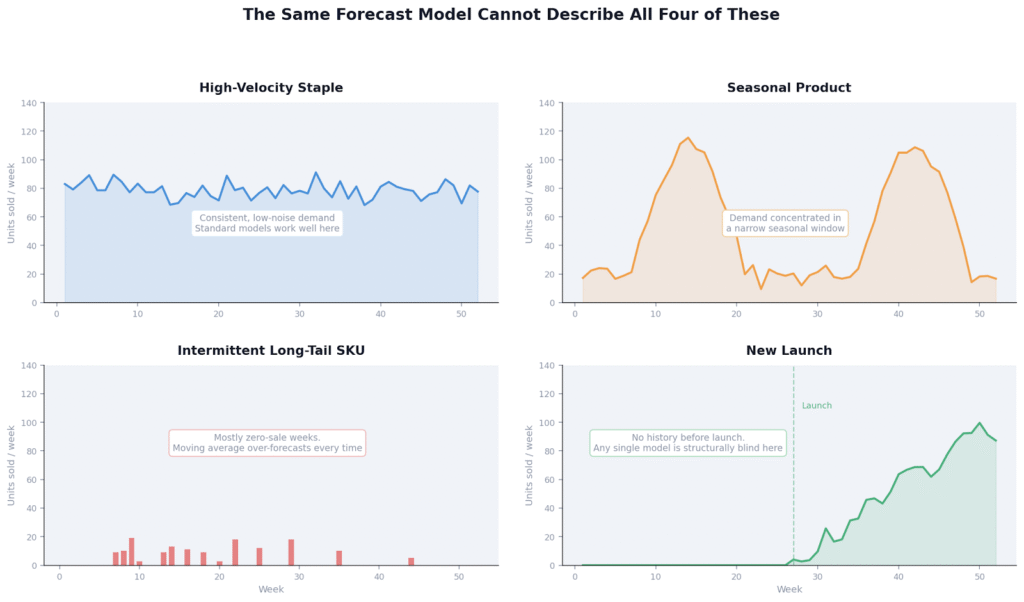
Four SKU types from a typical D2C catalog. Each has a fundamentally different demand shape. One model cannot describe all four.
What Actually Goes Wrong
Your best SKUs stockout quietly
High-velocity products with consistent demand are actually the easiest to forecast accurately, but only if the model is properly fitted to their sell-through rate and demand variability. When brands apply generic settings across the catalog, they systematically underestimate their core movers. The stockout happens, revenue drains, and you don’t see it in the forecast output. You see it weeks later as a gap in your Shopify numbers.
Your long tail builds up dead stock
SKUs with intermittent demand, the ones that sell sporadically with lots of zero-sale weeks, are a known hard problem in forecasting. Standard time-series methods were built for continuous demand signals. Apply them to zero-inflated SKUs and the model reads noise as signal, over-forecasts, and recommends buys that result in inventory sitting in your warehouse for months. The math is producing a number, so it looks like a forecast. But it’s not. It’s a guess with decimal places.
Errors compound over time
A bad buy cycle creates excess stock. Excess stock reduces urgency to reorder. Reduced urgency leads to a stockout six weeks later. The stockout triggers an emergency PO, usually at a higher MOQ than you wanted, which creates the next wave of excess. Each error makes the next one more likely, and without a system that re-evaluates on actuals every cycle, the drift compounds quietly until it’s a real cash problem.
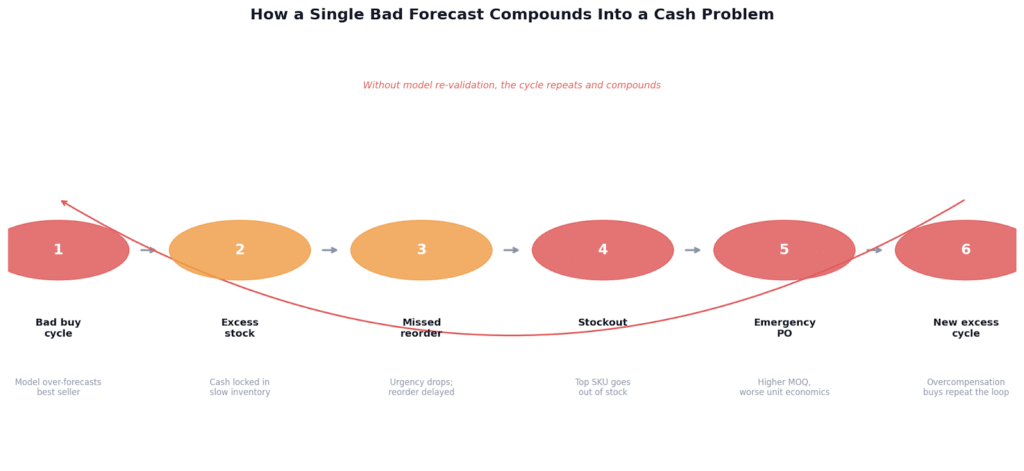
A single bad forecast cycle does not self-correct. Without model re-validation, each error increases the probability of the next.
The Fix Is an Architecture Change, Not a Better Spreadsheet
What actually works is running a competition across forecasting methods per SKU, not picking one method and applying it everywhere.
Run multiple models against each SKU and let them compete
Run Moving Average, Holt-Winters, SARIMA, Croston, Prophet, and regression-based approaches against each SKU independently. Validate each candidate on a holdout period of actual sales data, not in-sample fit. Select the winner based on real holdout error. Your seasonal SKUs get SARIMA. Your intermittent tail gets Croston. Your promo-driven products get a regression-aware model. The math fits the demand shape, not the other way around.
Re-validate every cycle, not just at setup
A model that was the best fit in Q1 may not be the best fit in Q3. Demand behavior shifts when you open a new channel, when a competitor changes pricing, when a promo pattern changes. The winning model per SKU needs to be re-evaluated against what actually happened, every cycle, so the system stays calibrated rather than drifting over time.
Force the forecast into decisions, not charts
A forecast sitting in a dashboard is not a plan. The output needs to be three decisions per cycle: what to reorder (quantity and timing, accounting for lead times and MOQs), what to flag as overstock before it becomes dead capital, and where to redistribute inventory so it sits where demand exists rather than where it was last shipped. The goal of forecasting is not a number. The goal is a decision you can act on.
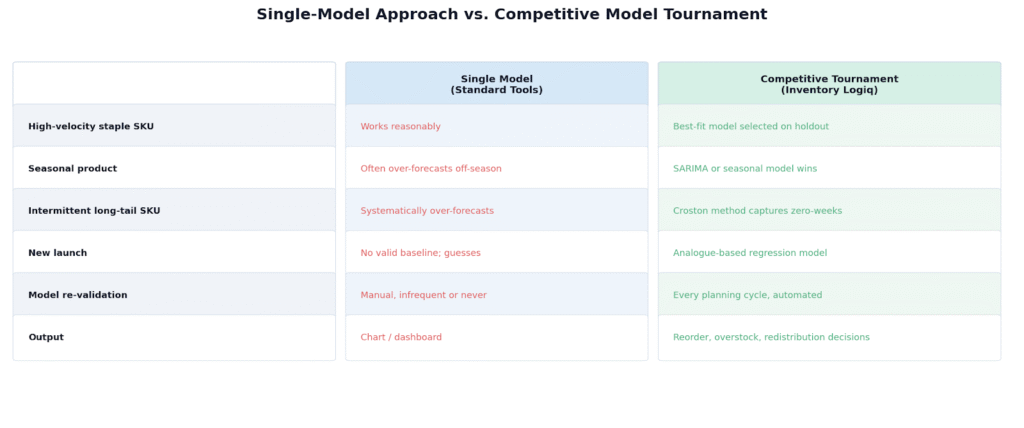
Single-model forecasting vs. competitive model tournament: what each approach produces for different SKU types.
Why Most Tools Still Get This Wrong
Most inventory planning tools sell you platform access. You get a dashboard, configurable settings, forecast charts. What you don’t get is someone who translates those outputs into actual buy decisions, and that translation step is where the value typically gets lost.
The tools work reasonably well when your catalog is small, demand is stable, and you have a dedicated ops team comfortable enough with the system to interpret its outputs correctly. As you scale, more SKUs, more locations, more demand variability, the gap between what the dashboard shows and what the right decision actually is tends to widen. The tool gets more complex. The decisions don’t get clearer.
What D2C brands in the 1M to 5M revenue range actually need is not more data to look at. It’s fewer, better decisions on a cadence they can actually execute against.
If Any of This Sounds Familiar
If your current setup is producing any of the following, the forecasting architecture is the bottleneck, not the effort:
- Recurring stockouts on your top 20% of SKUs despite having a forecast in place
- More than 15 to 20% of inventory aging past 90 days regularly
- Emergency POs showing up more than once a quarter
- Planning cycles that consume more than a week of your team’s time
At Inventory Logiq, we run a competitive model tournament on your catalog every planning cycle. Our team, data scientists and account managers working together, selects the best-fit forecasting model per SKU, validates it on actuals, and delivers reorder, overstock, and redistribution decisions you can act on directly. No dashboards to interpret. No translation step between forecast and decision.
If you want to see what this looks like on your actual catalog, request a planning sample.