What is Inventory Analytics? Meaning, Types, Inventory Analytics Metrics, 5 Benefits of Inventory Data Analysis for Your Business in 2023
October 31, 2022


It is supremely important for every eCommerce business to have an idea about their previous performance, whether it was strong or weak, to understand the factors that contributed to those results so they can either replicate it or mitigate it in the future. The main way to do this is through inventory analytics which helps retailers analyze a variety of metrics such as high-demand products, low-demand products, storage costs, and much more. In this article, we will go into depth about inventory analytics and understand the types, metrics, and benefits.
What is Inventory Analytics?
Inventory analytics studies inventory to estimate the quantity of a product a company should have on hand. Companies may decrease expenditures and enhance operational efficiency by managing inventory levels.
Inventory analytics provides crucial insights into product management, allowing organizations to implement cost-effective solutions and improve operations.
- Companies cannot track items efficiently as they move through the supply chain without a robust inventory data analysis. This can lead to inconsistencies, low supply levels, and backorders.
- Inventory analytics aims to quantify essential performance metrics, allowing businesses to monitor and adapt management approaches in real-time.
- Managers may enhance their decision-making by incorporating inventory data into their daily activities.
- Inventory analysis ensures that you have the proper quantity of inventory on hand, lowers your operating expenses, and encourages improved demand forecasts.
Types of Inventory Analytics
Thanks to inventory data analysis, inventory management has become more advanced and demand forecasting can be done in an efficient manner. Inventory analytics may also reveal information about client behaviour, product performance, and channel performance.
There are different types of inventory analytics, depending on the values provided by the data. These are classified as below:
Descriptive Inventory Analytics
Descriptive inventory analytics reveal the status of inventory in a descriptive way. This method is the simplest to implement, with major inventory management platforms supplying predefined descriptive statistics straight away.
- Analytics include system information, such as the number of items in stock and price per unit. The descriptive analytics stage provides visibility into inventory levels across the supply chain.
- End-to-end reports reveal the location of inventory in the supply chain.
- They can demonstrate how the stockpiles of raw materials, intermediate products, and final products cover sales.
- People learn to think in terms of value rather than just units. And they begin to realise how stocks at all levels pile up to satisfy the same levels of demand.
Diagnostic Inventory Analytics
Diagnostic inventory analytics explain the reason behind a trend that is occurring. Principle cause analysis is a diagnostic process, which is necessary when presenting information to make decisions.
For example, simply knowing that a firm grew month on month is not useful. Leaders must understand why there was this increase, in order to apply the lessons learned to other operations or products.
- Diagnostic analytics assists in identifying and understanding shortages and overstock.
- It urges managers to look beyond overall inventory value. It distinguishes between healthy and unhealthy inventory by displaying the inventory quality.
- To do this, the organisation needs comprehensive inventory objectives but these targets do not need to be accurate.
- Simple procedures are generally adequate to establish the appropriate minimum and maximum stock levels.
Predictive Inventory Analytics
Predictive inventory analytics attempt to forecast the future pattern of inventory. You can use these tools to plan ahead of time and make changes as needed.
For example, machine learning is all about leveraging automation to learn from historical data and predict future patterns.
- Professionals can employ predictive analytics to look at seasonal needs from the prior year or they can use past knowledge of why something occurred.
- Predictive analytics can alert you to potential shortages and hazards associated with slow-moving or outdated stocks.
- Algorithms can inform planners if stockpiles are approaching the end of their shelf life by combining data on inventory and demand.
- They can issue alerts if inventory levels go dangerously low, resulting in lost sales very quickly.
Prescriptive Inventory Analytics
Prescriptive inventory analytics is a highly sophisticated approach to inventory data analysis. These numbers will tell you precisely what should be done. A correct prescriptive analysis with relevant data may be able to help you determine the different stock levels to meet different sizes of orders.
With the relevant data, inventory management analysis systems may estimate the quantities of an item necessary to meet 90% of requests in three days.
- Prescriptive analytics can give suggestions for methods to improve inventory efficiency.
- Such a suggestion should originate from the planning system.
- Inventory analytics should be able to suggest solutions that a standard planning system cannot, such as “move additional products from location A to location B to reduce the risk of expiration.”
8 Important Inventory Data Analytics to Keep Track of in 2023
Once you’ve been acquainted with various inventory measurements, you need to understand how to get value out of them. It’s critical to keep track of your inventory statistics on a regular basis so that you can include them in making appropriate decisions.
There are various measures that should be utilised to assess performance and find opportunities for improvement. They are listed below:
Gross Margin Returns on Investment (GMROI)
GMROI is a straightforward ratio used to assess the profitability of your inventory over a certain time period. It calculates a retailer’s gross profit for every dollar of goods acquired.
The formula for figuring out your GMROI is:
Gross Margin / Average Inventory Cost
Any GMROI ratio less than 1.0 indicates that a firm is losing money for every dollar invested in inventory. Anything above 1.0 indicates that a company is selling things for more than it cost the company to acquire.
It should be noted that this is not a measure of bottom-line profitability, because only COGS is included as a cost, not total spending. However, this provides a clear indicator of how lucrative your inventory is, based on current pricing points and purchasing practices.
Average Fulfillment Cost Per Order
Average fulfillment cost per order tells you how much it costs to choose, pack and ship each order. There are numerous costs to consider when looking at the full retail fulfillment process. Examine the following expenses to determine overall fulfillment costs:
- Receiving, storing, and controlling inventory
- Standard or customised packaging
- Pick and pack labour
- Postage and shipping labels
- Shipping supplies and expenses
- Outfitting and assembly (if applicable)
- Returns management procedure
The cost of fulfillment varies depending on whether you complete processes in-house or work with a 3PL according to their pricing model.
Total Units in Storage
Real-time monitoring of inventory analytics accounts for all of your items across all fulfillment locations and can assist you in calculating total units in storage or total inventory. This number is continuously changing, as you sell and reorder units, add new goods, and process returns.
The more SKUs you have, the more careful you need to be about storage expenses, overstocking, and the amount of capital locked up in inventory. Many organisations overpay for storage they don’t need, raising their inventory holding expenses needlessly.
Inventory Reconciliation
A procedure for inventory reconciliation can help you eliminate stock inconsistencies and better understand why they exist in the first place.
Inventory reconciliations should be performed on a regular basis to verify that you are tracking and documenting value fluctuations due to outdated inventory or shifts in product demand. Here’s a quick rundown of the processes to correctly reconcile inventory:
- Examine your physical inventory
- Contrast the physical count with the inventory records
- Examine the most recent inventory deliveries and shipments
- Determine if there are any inconsistencies
Inventory reconciliations must be scheduled at regular, preset periods to ensure consistency and inventory accuracy.
Backorder Rate
A backorder occurs when a sale is made but the merchandise for the order is not yet available. This slows down order fulfillment and shipment, as well as last-mile delivery.
The item is then supplied to the client at a later date since it is not in stock. Backorders can arise for high-demand items. However, frequent back-ordering might result in poor consumer satisfaction. The backorder rate of a corporation is the percentage of orders made that will be delivered at a later date owing to a lack of available inventory.
It is calculated as follows:
(Number of Undeliverable Orders/ Total Number of Orders) x 100
A high backorder rate can indicate an unusual shift in demand, a lack of safety stock, or manufacturing delays.
Inventory Turnover Ratio
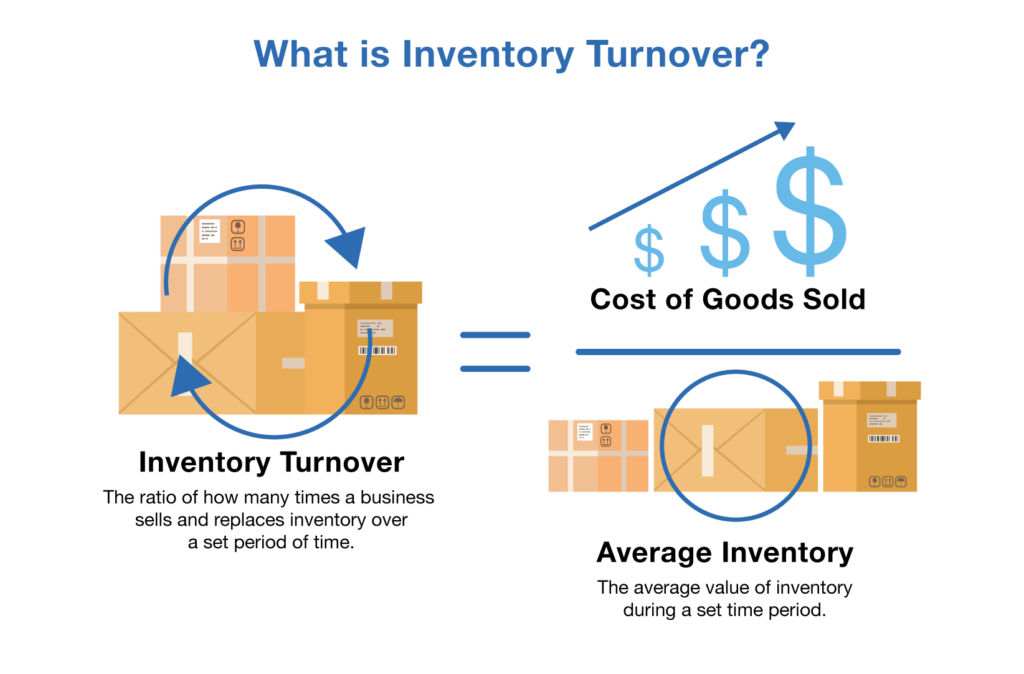
The inventory turnover ratio calculates how many times a corporation sold and replenished (i.e., turned over) its inventory during a certain time period. Because a high turnover rate is related to selling a lot of items, inventory turnover may really confirm the efficiency of your organisation.
The following formula is used to determine turnover:
Inventory turnover ratio = [cost of goods sold average inventory]
A benchmark inventory turnover ratio of 2 to 4 is good for analysing the findings but keep in mind that it might vary depending on your business. A ratio within this range indicates:
- Your logistics, both incoming and outgoing, are optimised.
- You are replenishing inventory that corresponds to your sales cycle.
- You are receiving new goods on schedule, based on manufacturing and warehouse receiving lead times.
Inventory Shrinkage
When actual inventory levels do not match inventory records, it is referred to as inventory shrinkage. This might be due to a variety of circumstances, such as theft, shipment damage, or inventory accounting problems.
Shrinkage is an inherent challenge for retailers but understanding the scope of the problem can help them gain better control over their inventory. Choosing and sticking to an inventory valuation system may promote consistency and accuracy, saving a lot of hassles during tax season.
Here is a formula for calculating the rate of inventory shrinkage:
{(Recorded Inventory – Actual Inventory) / Recorded} x 100
Inventory Carrying Costs
Carrying costs encompass all charges that are connected with retaining or storing acquired and unsold finished goods and items. Common carrying costs include storage, labour, and insurance but they can also include opportunity and inventory depreciation costs.
Carrying costs account for around 30% of overall inventory expenses and the exact costs vary depending on a variety of factors, including the number of total SKUs being stored and your typical inventory turnover rate.
To get an understanding of how carrying costs are calculated, sum up all of your inventory expenditures and divide the total by your current inventory value to obtain a percentage of how much you’re really spending to keep inventory.
The formula is as follows:
(Storage Costs + Employee Salaries + Opportunity Costs + Depreciation Costs) / Total Value of Annual Inventory
What are the Benefits of Inventory Data Analysis?
Achieve Optimum Levels of Inventory
Stock visibility increases when you do frequent checks of inventory levels and other related indicators like total units in demand, cost of storage, etc. A comprehensive picture of stocks generated from these systems can help you in determining the number of stocks that are required to be ordered currently and the approximate time for reordering.
You gain better control over your firm by retaining just enough inventory to fulfill client demand while avoiding excess or stale products.
Reduce Wastage of Inventory
To create a supply network that can be regarded as continual, you must account for all the purchases and sales occurring in your setup. Reduce writing off and writing down inventory in order to boost a company’s inventory value and revenue.
Consider establishing programs and checks that will assist you in tracking critical inventory data and making better inventory optimization decisions by utilising automation.
Reduce Costs Associated with Inventory
As your inventory is likely to hold 30-50% of your working capital, a lot of money is invested in it. A proper analysis can help to judge the reasons for high costs at different levels with respect to inventory. Based on the facts, you may take corrective action to improve your bottom line.
Reduce the Amount of Backorders
Too many backorders reflect negatively on your company. To ensure an optimal stock level, you will need data and clarity on your inventory levels at all times, to make informed and calculated decisions based on real-time data.
For example, studying patterns such as previous season data might help you forecast future demand and thus, stocks to be maintained based on seasonality factors. It will also cut stockout expenses and backorders.
Accurate Forecasting of Inventory Levels
Dead stock is frequently the consequence of incorrect inventory forecasting, which is why an inventory analysis system is essential. A reliable inventory analysis and reporting plan will collect data on all of your SKUs, which will ultimately increase forecasting and reordering accuracy. Furthermore, this information can be utilised to modify prices and increase revenue.
What Inventory Analytics Services Does Inventory LogIQ Provide?
InventoryLogIQ works with eCommerce businesses ranging from startups to enterprises to handle everything from storage and inventory management to effectively, and precisely enable the availability of the right inventory at the right time.
An inventory planning system can track each client’s inventory conveniently, including stock availability, pallet ID numbers, serial numbers, and expiration dates. eCommerce clients of InventoryLogIQ can access this data in real-time, allowing them to manage their warehouse, inventory, and shipping operations in a hassle-free and convenient way.
InventoryLogIQ, our AI-enabled inventory optimisation SaaS platform performs an in-depth analysis to gauge the health of your inventory at 3 levels: business, sales share category vs geographical zone,
and individual SKU. It considers critical parameters such as inventory turnover, days of inventory on hand, geographical inventory share, etc. as part of its inventory analytics services.
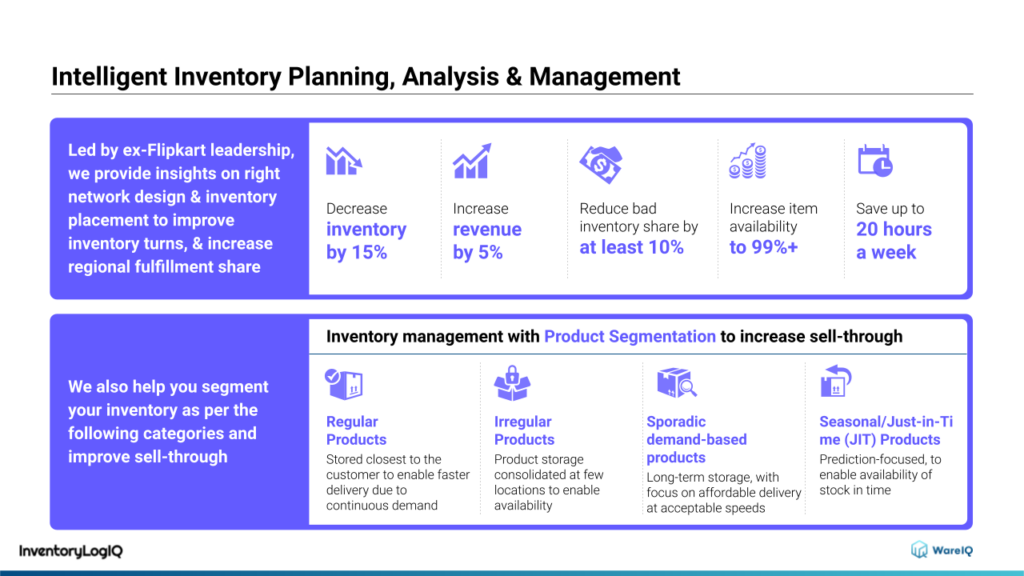
Our inventory management software also provides measurable inventory analytics that will help in demand forecasting and can help you ascertain how much inventory you need to keep of each product during a certain time period.