Inventory to Sales Ratio: Definition, Importance, 80/20 Rule and Metrics Used to Calculate Stock Turnover Ratio in 2023
January 17, 2023


There are many aspects of running an eCommerce business that retailers need to focus on but one of the most important aspects is inventory and having a proper method in place for inventory management. Inventory can comprise a range of products, at various stages of completion, but the most significant are finished goods because those are what are ultimately sold to end consumers and earn revenue for the business.
When a business generates the maximum number of sales from the available inventory, it is considered a successful business. The way to measure this success is through the inventory-to-sales ratio. We will go in-depth on what it is, how to calculate it, understand its importance, and how InventoryLogIQ can help.
- What is Inventory to Sales Ratio?
- How to Calculate Stock Turnover Ratio?
- Why is it Important to Know the Inventory to Sales Ratio in 2023?
- Understanding the 80/20 Rule of the Inventory to Sales Ratio
- What Metrics are Used to Measure the Stock Turnover Ratio?
- Conclusion: How InventoryLogIQ Can Help Maintain the Ideal Inventory to Sales Ratio For Your Businesses
- Inventory to Sales Ratio: FAQs
What is Inventory to Sales Ratio?
The inventory-to-sales ratio, also called the stock turnover ratio, is a metric used to measure the amount of inventory a company has for sale. This ratio can assess whether a company has too much or too little inventory relative to its sales volume. It can be a helpful tool for managing inventory levels. A high inventory-to-sales ratio may indicate that a company carries too much inventory, which can tie up working capital and lead to higher storage and inventory handling costs. On the other hand, a low ratio could suggest that a company is not carrying enough inventory to meet customer demand, which could lead to lost sales.
An ideal ratio will vary depending on the industry and type of business, so it is essential to compare a company’s stock turnover ratio with others in its sector. The inventory to sales ratio is a helpful tool for managing inventory levels. Still, it is important to remember that it is just one metric that should be considered when making decisions about inventory. Other factors, such as lead time, customer demand, and seasonality, can also impact inventory levels and should be considered.
How to Calculate Stock Turnover Ratio?
The stock turnover ratio is a key performance indicator that measures the number of times inventory is sold or used. There are two ways to calculate the stock turnover ratio:
Average Inventory/Cost of Goods Sold
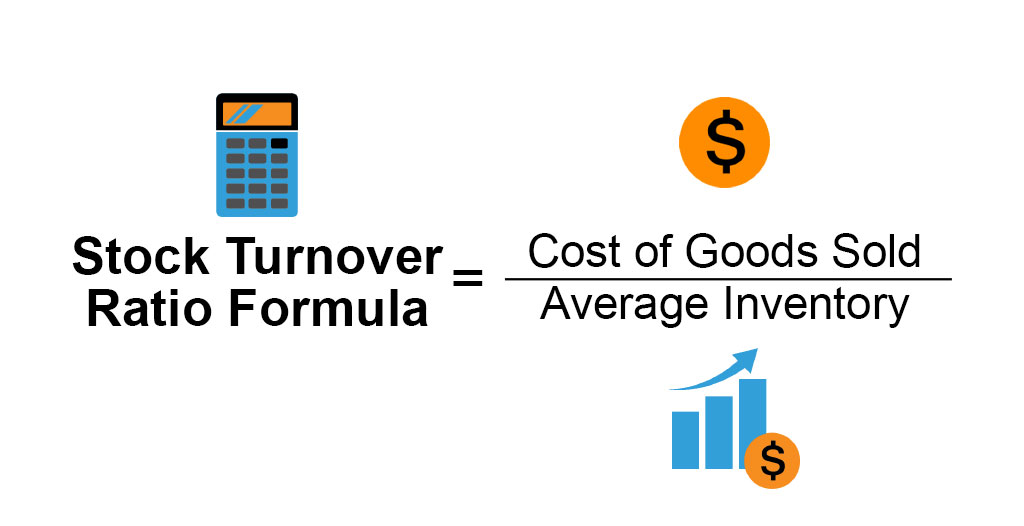
This is more common and provides a better understanding of how well a company manages its inventory. To calculate the stock turnover ratio using the average inventory method, divide the average inventory by the cost of goods sold.
Inventory on Hand/Cost of Goods Sold

This method can be useful for companies with high levels of stock. To calculate the stock turnover ratio using the inventory-on-hand method, divide the inventory on hand by the cost of goods sold. The stock turnover ratio is important because it shows how efficiently a company uses its inventory. A high ratio means that inventory is being turned over quickly and a low ratio means it takes longer to sell stock. A high stock turnover ratio is generally seen as a good thing because it means a company sells its inventory and makes money.
However, a very high stock turnover ratio could also indicate that a company cannot keep up with demand, which could lead to lost sales. To get the most accurate picture of a company’s stock turnover ratio, it is essential to compare it to other companies in the same industry. This will give you a better idea of what is considered normal for that industry and whether or not the company’s stock turnover ratio is good or bad.
Why is it Important to Know the Inventory to Sales Ratio in 2023?
Provides an Accurate Depiction of Business Performance
The inventory-to-sales ratio is a key metric for businesses, indicating how well a company manages its inventory. If the ratio is too high, it may indicate that the company is carrying too much stock and not selling it quickly enough. This can tie up working capital and lead to cash flow problems. On the other hand, if the ratio is too low, it may indicate that the company is not carrying enough inventory to meet customer demand. This can lead to lost sales and missed opportunities.
Helps Mitigate Uncertainty
It is essential for businesses to monitor their inventory-to-sales ratio and strive to maintain an optimal level. The ideal ratio will vary from industry to industry and even company to company, depending on product turnover rates and seasonality factors. However, as a general rule of thumb, a healthy inventory-to-sales ratio is usually between 0.16 and 0.25. This will help businesses maintain accurate levels of inventory even when unforeseen circumstances arise. (read further under inventory accuracy)
Determines the Optimum Level of Inventory
A high stock turnover ratio indicates that inventory is selling quickly and efficiently. Ideally, you want a high stock turnover ratio because your inventory is fresh and you’re not spending much money on unsold goods. A high stock turnover ratio also indicates that you have efficient ordering and stocking procedures. On the other hand, a low stock turnover ratio could be a sign that you’re overstocking or carrying slow-moving items. Either way, the stock turnover ratio helps you determine the optimum amounts of inventory you need to store in order to satisfy demand and reduce operational costs.
Compares Your Business With Competitors
In some cases, you may want to reevaluate your inventory levels and product mix. You can also compare your company’s stock turnover ratio to industry norms to see how you stack up. If your ratio is significantly higher or lower than the average, it could indicate something is amiss. This will help you to understand what needs to be changed and can reduce any competitive advantage that rival companies had previously.
Understanding the 80/20 Rule of the Inventory to Sales Ratio
The 80/20 rule is a guideline that states that 80% of a company’s inventory is typically sold 20% of the time. This rule can help businesses manage their inventory levels and ensure they are not carrying too much stock. The 80/20 rule is based on the Pareto principle, which states that roughly 80% of the effects come from 20% of the causes of many events. The 80/20 rule applies in various situations, including business and economics.
Inventory management is critical to any business, as it can directly impact profitability. Too much inventory can tie up working capital and lead to storage expenses and other inventory costs, while too little stock can result in lost sales and customer dissatisfaction. The 80/20 rule can be a helpful tool for managing inventory levels. By understanding that most of the sales will come from a small portion of the inventory, businesses can focus on ensuring they have enough stock of the items that are most popular with customers and can limit the supply of slow-moving or low-demand items. There are a few different ways to apply the 80/20 rule to inventory management :
- One approach is to keep a close eye on the inventory turnover rate, which measures how often the average item in stock is sold. A high turnover rate indicates that items are selling quickly and may need to be replenished more frequently, while a low turnover rate suggests too much stock is on hand.
- Another way to use the 80/20 rule is to track the sales of each stock-keeping unit (SKU). This information can help businesses identify which items are selling well and which may need to be discontinued.
- Finally, the 80/20 rule can also be applied to pricing. By understanding that most sales will come from a small portion of the inventory, businesses can price their products accordingly. For example, if a company knows that 80% of its sales come from 20% of its SKUs, it may choose to offer discounts on the remaining 80% of SKUs to boost overall sales.
The 80/20 rule is a helpful tool for managing inventory levels but it is essential to remember that it is only a guideline. No hard and fast rule says precisely how much inventory should be kept on hand. Each business needs to tailor its inventory management strategy to its unique needs and circumstances.
What Metrics are Used to Measure the Stock Turnover Ratio?
A few different metrics can be used to measure the stock turnover ratio. Let us take a look at the most common ones:
Frequency of Sales

The most common metric is simply the number of times that inventory is sold over time. This metric can be expressed as a rate (e.g., how many times per year stock is sold) or as a percentage (e.g., what percentage of inventory is sold each year) and helps in gauging if a product is doing well or poorly and actions can be taken accordingly.
Average Inventory Level

Another standard metric is the average inventory level, which measures how much inventory is on hand at any given time. This metric is important because it helps show how quickly stock moves through the company and which items need to be replenished at a faster rate than others. It also shows which items are being underutilized and are eating up storage space.
Day Sales in Inventory
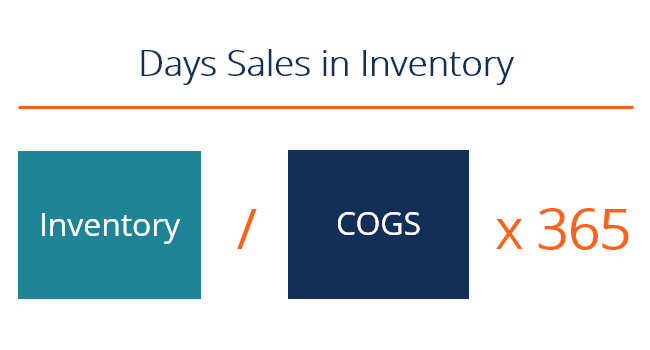
Finally, another metric sometimes used to measure the stock turnover ratio is the day’s sales in inventory (DSI) metric. This measures the days it takes to sell all the inventory on hand. This metric is important because it can help show how efficiently a company sells its inventory. It also helps companies analyze which parts of their sales strategy are working and which aren’t. To calculate the day’s sales of inventory, you can use the day’s sales of inventory formula:
Days Sales in Inventory Forumula = (Average Inventory ÷ COGS), multiplied by 365.
All of these metrics are important in measuring the stock turnover ratio. Still, the most important one is probably the number of times that inventory is sold. This metric gives the clearest picture of how quickly inventory moves through the company.
Conclusion: How InventoryLogIQ Can Help Maintain the Ideal Inventory to Sales Ratio For Your Businesses
Inventory to sales ratio is a useful metric for measuring a company’s efficiency in managing its inventory. It provides insight into how well a company is able to turn its inventory into sales, which can help identify potential issues such as overstocking or slow-moving items. By monitoring this ratio, businesses can make adjustments to their inventory management strategies to improve their financial performance and ensure that they are not carrying excess inventory.
Additionally, comparing the ratio to industry standards or historical data can provide valuable context for interpreting the results. Overall, inventory to sales ratio is an important metric for businesses to track and use as a tool for making more informed decisions. You can opt to partner with InventoryLogIQ to achieve a healthy inventory-to-sales ratio.
InventoryLogIQ provides a comprehensive and intuitive solution that can help you optimize your warehouse operations, reduce costs and improve customer satisfaction. Our OMS software is designed to give visibility into every aspect of your warehouse operations, from inventory management to order fulfillment. We also offer tools to help you streamline all your eCommerce processes and improve efficiency all along the supply chain. InventoryLogIQ helps you take control of your inventory data at geographic and SKU-level to unlock operational agility by enabling you to avoid stock-outs and excess inventory. Our solution helps you be accurate and highly responsive through the following features:
- Network planner to place fast-moving inventory closest to customers to improve delivery speed and lower shipping cost
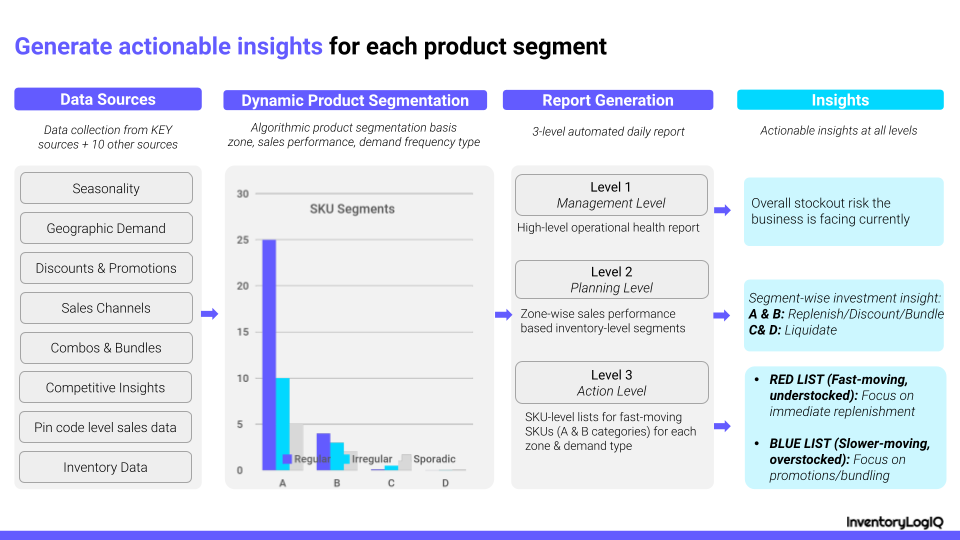
- Dynamic product segmentation to generate replenishment & liquidation reports to avoid sales loss and free up working capital, respectively
- AI algorithms to generate frequent sales forecasts factoring in seasonality and marketing spend